Creating a Customized Report Template
Report Templates are Tripwire-defined or custom templates for Reports. A Report Template that has been configured to include user-specified filter values (specific Assets, time ranges, Data Sources, etc.) is referred to as a Configured Template. The parameters that can be configured vary for each type of Report Template.
To edit, publish, or delete a customized Report Template, see Working with Customized Report Templates.
This topic includes the following procedures:
Creating an Original, Customized Report Template
Creating a Customized Report Template by Duplicating an Existing Report Template
Each of these procedures employs an example for illustration purposes.
|
Caution: |
To create a customized Report Template, the ConnectAdmin permission must be assigned to your user account. |
|---|
Creating an Original, Customized Report Template
This topic explains how to create and configure a customized Report Template. Consisting of four Steps, it illustrates the process by adding one Input and two Panels to the Template.
Step 1. Create the Report Template
| 1. | In the side bar, select Connect Reporting > Reporting. |
| 2. | In the TEMPLATES tab, click NEW TEMPLATE. |
| 3. | Complete the Create New Template panel (see Table 1) and click CREATE. |
You will now configure the new Template by adding Inputs and Panels.
|
Note: |
To save the Report Template, you must add at least one Panel or Input. |
|---|
|
Field |
Description |
|---|---|
|
Type |
The category for this customized Report Template. |
|
Title |
The name of this customized Report Template. |
|
Description |
(Optional) A description for this customized Report Template. |
Step 2. Add a Time Input to the Report Template
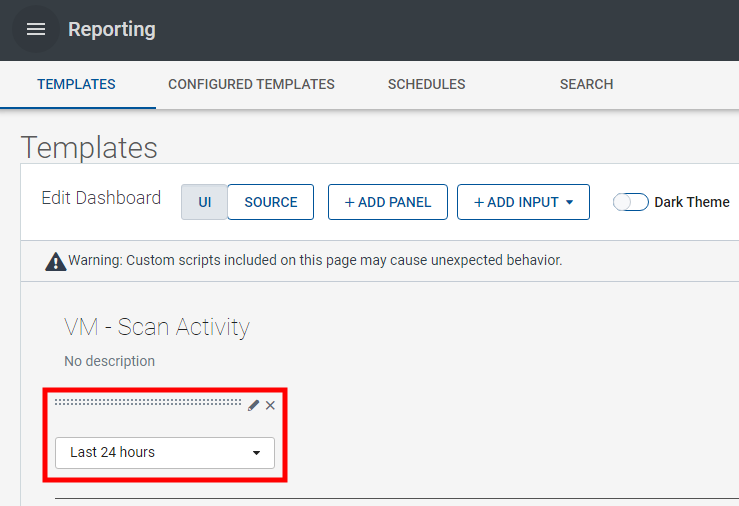
| 1. | In the TEMPLATES tab, click ADD INPUT and select Time. |
Tripwire Connect adds the Input to the Report Template (see Figure 2).
Figure 2. The Time Input added to the Report Template
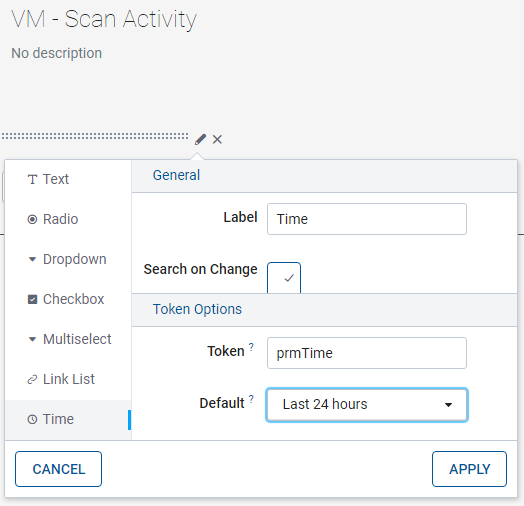
| 2. | Click  Edit Input. Edit Input. |
| 3. | Complete the configuration fields (see Figure 3) and click APPLY. |
|
Tip: |
For more information about a field, click the adjacent ? Help button. |
|---|
Figure 3. Configuration fields for the Time Input
| 4. | Click SAVE and then EDIT. |
Step 3. Add a Column Chart Panel to the Report Template
| 1. | In the TEMPLATES tab, click ADD PANEL. |
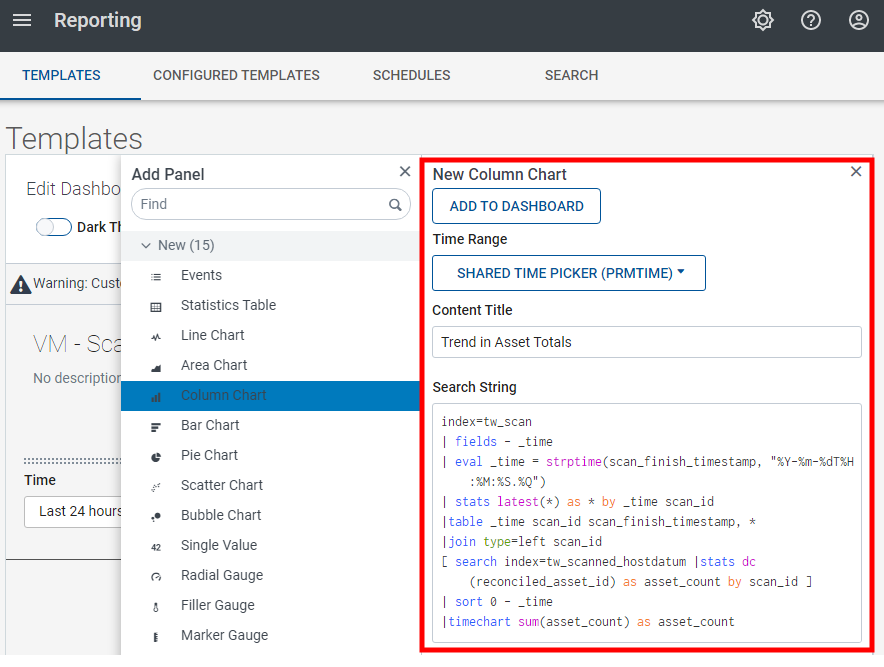
| 2. | In the Add Panel panel, select New > Column Chart (see Figure 4). |
Figure 4. The Add Panel panel in the TEMPLATES tab

| 3. | In the New Column Chart panel, enter the following query in the Search String field: |
index=tw_scan
| fields - _time
| eval _time = strptime(scan_finish_timestamp, "%Y-%m-%dT%H:%M:%S.%Q")
| stats latest(*) as * by _time scan_id
|table _time scan_id scan_finish_timestamp, *
|join type=left scan_id
[ search index=tw_scanned_hostdatum |stats dc(reconciled_asset_id) as asset_count by scan_id ]
| sort 0 - _time
|timechart sum(asset_count) as asset_count
| 4. | In the New Column Chart panel (see Figure 5): |
| a. | Click Use time picker and select SHARED TIME PICKER (PRMTIME). |
| b. | In the Content Title field, enter a title of your choice for the Column Chart panel. |
| c. | Click ADD TO DASHBOARD. |
Figure 5. The New Column Chart panel in the TEMPLATES tab
| 5. | Close the Add Panel panel. |
| 6. | Click SAVE and then EDIT. |
Step 4. Add a Statistics Table Panel to the Report Template
| 1. | In the TEMPLATES tab, click ADD PANEL. |
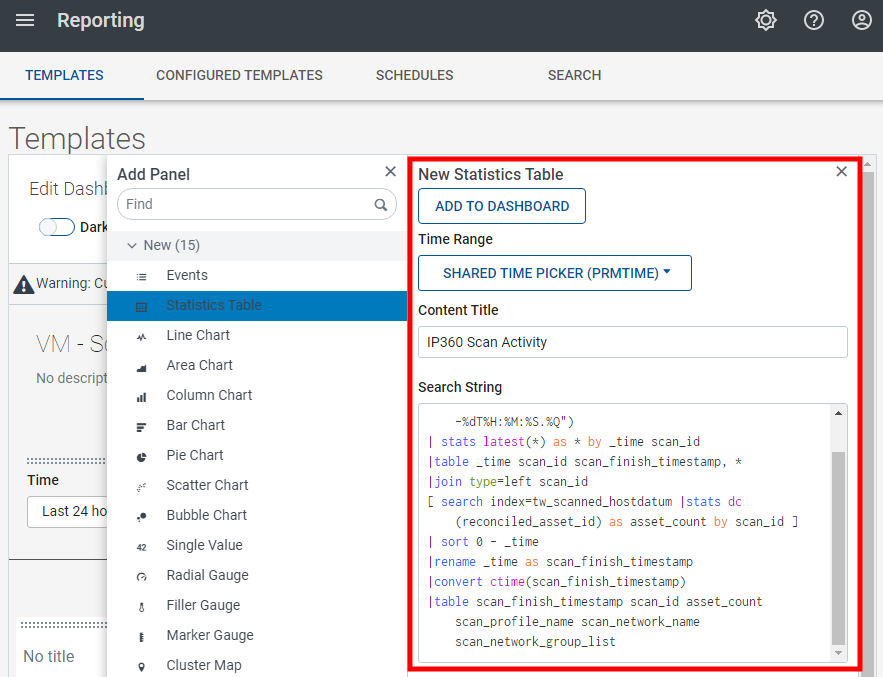
| 2. | In the Add Panel panel, select New > Statistics Table. |
| 3. | In the New Statistics Table panel, enter the following query in the Search String field: |
index=tw_scan
| fields - _time
| eval _time = strptime(scan_finish_timestamp, "%Y-%m-%dT%H:%M:%S.%Q")
| stats latest(*) as * by _time scan_id
|table _time scan_id scan_finish_timestamp, *
|join type=left scan_id
[ search index=tw_scanned_hostdatum |stats dc(reconciled_asset_id) as asset_count by scan_id ]
| sort 0 - _time
|rename _time as scan_finish_timestamp
|convert ctime(scan_finish_timestamp)
|table scan_finish_timestamp scan_id asset_count scan_profile_name scan_network_name scan_network_group_list
| 4. | In the New Statistics Table panel (see Figure 6): |
| a. | Click Use time picker and select SHARED TIME PICKER (PRMTIME). |
| b. | In the Content Title field, enter a title of your choice for the Statistics Table panel. |
| c. | Click ADD TO DASHBOARD. |
Figure 6. The New Statistics Table panel
| 5. | Close the Add Panel panel. |
| 6. | Click SAVE. |
The new, customized Report Template opens (see Figure 7).
| 7. | (Optional) To make the new Report Template available to other Connect users, click PUBLISH. |
|
Note: |
For further assistance, please contact Tripwire Professional Services (https://www.tripwire.com/services or through your Tripwire sales representative). |
|---|
Figure 7. The new Report Template

Creating a Customized Report Template by Duplicating an Existing Report Template
In this topic, you will:
Create a new Report Template by duplicating the customized Report Template created in Creating an Original, Customized Report Template, and
Change the labels applied to the Legend, X axis, and Y axis in the Trend in Asset Totals Panel.
To create a customized Report Template by duplicating an existing Report Template:
| 1. | In the side bar, select Connect Reporting > Reporting. |
The TEMPLATES tab opens in the workspace.
| 2. | Select the check box for the Scan Activity Template. |
| 3. | At the top of the workspace, click . . |
| 4. | Complete the Copy Template panel (see Table 2) and click COPY. |
|
Field |
Description |
|---|---|
|
Type |
The category for the new, customized Report Template. |
|
Title |
The name of the new Report Template. |
|
Description |
(Optional) A description for the new Report Template. |
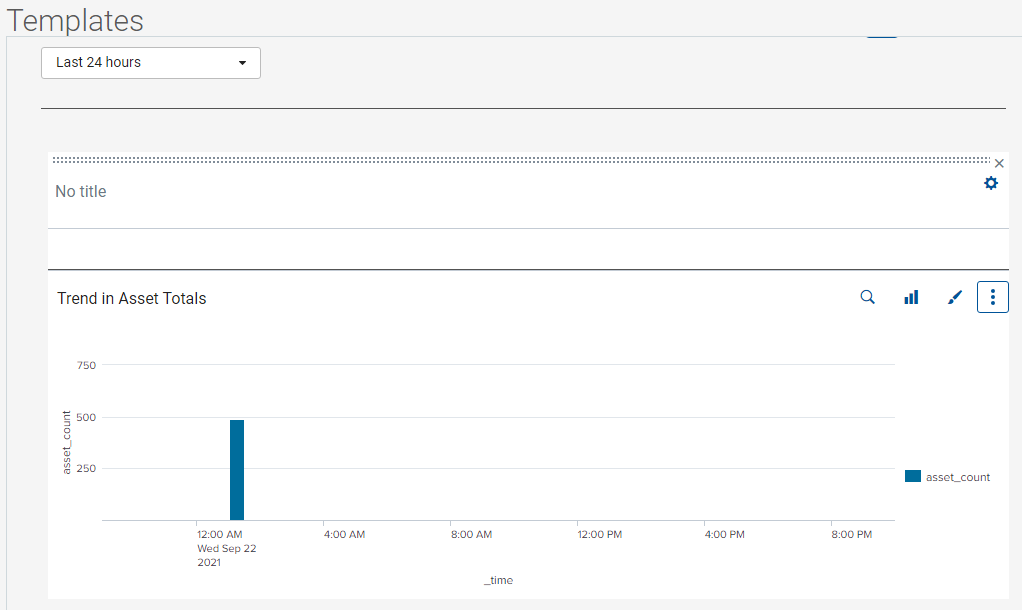
| 5. | In the Trend in Asset Totals panel (see Figure 8), click  Format visualization. Format visualization. |
Figure 8. The Trend in Asset Totals panel
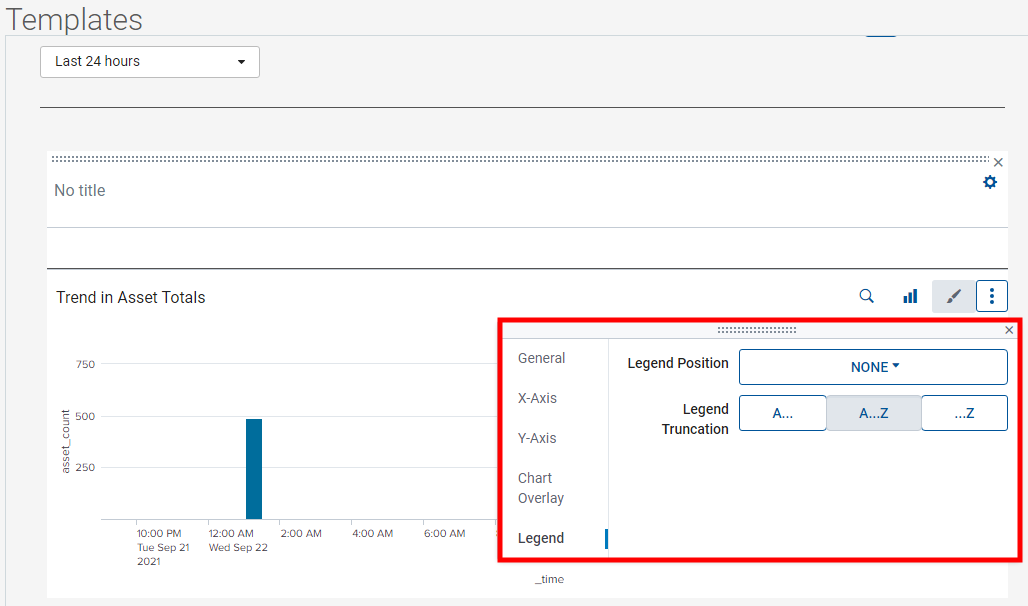
| 6. | In the Visualization properties dialog: |
| a. | Select Legend. |
| b. | From the Legend Position drop-down, select None (see Figure 9). |
Figure 9. The Legend tab in the Visualization properties dialog
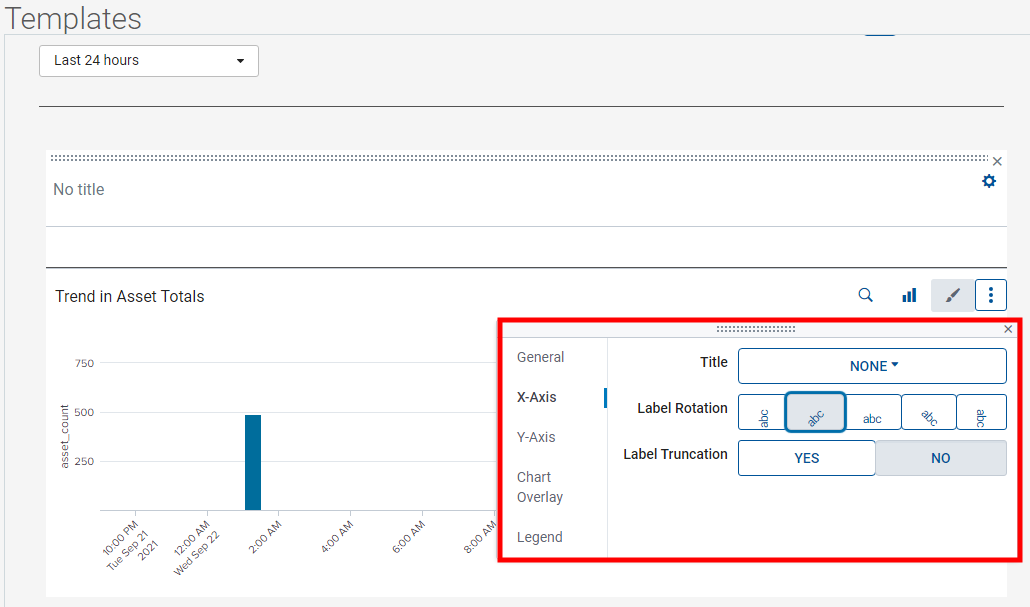
| 7. | In the X Axis tab of the Visualization properties dialog: |
| a. | Click the Title button and select None from the drop-down. |
| b. | For the Label Rotation, click -45° (see Figure 10). -45° (see Figure 10). |
Figure 10. X Axis tab in the Visualization properties dialog
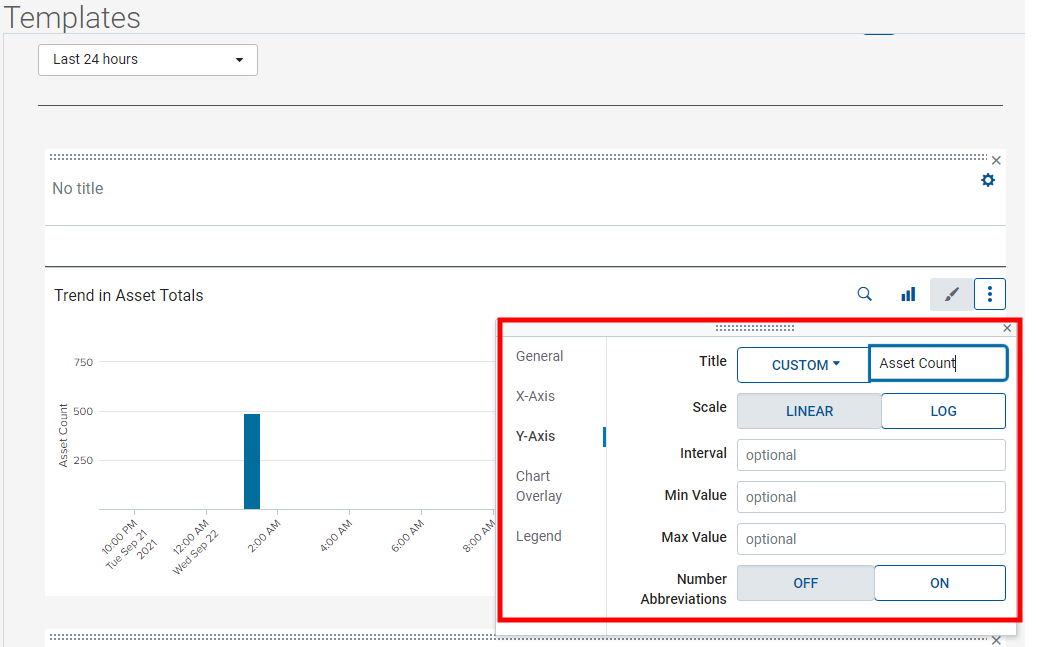
| 8. | In the Y Axis tab of the Visualization properties dialog: |
| a. | Click the Title button and select Custom from the drop-down. |
| b. | In the adjacent field, enter "Asset Count" (see Figure 11). |
Figure 11. Y Axis tab in the Visualization properties dialog
| 9. | Close the Visualization properties dialog. |
| 10. | Click SAVE. |
| 11. | (Optional) To make the new Report Template available to other Connect users, click PUBLISH. |